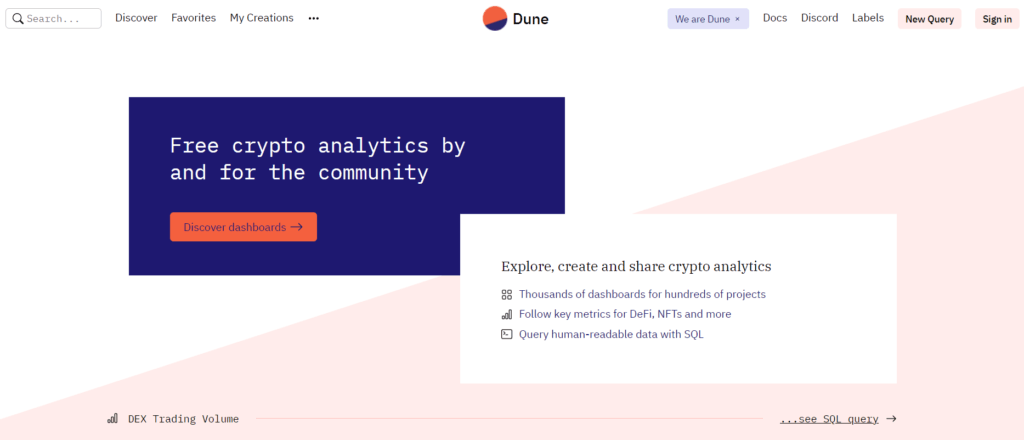
Dune Analytics is a unique on-chain data analytics platform for NFTs and decentralized finance. Its dashboards offer actionable, free data for your research.
Dune Analytics is one of the best resources online for blockchain data research. It’s also an indispensable tool for NFT and crypto investors since the platform emphasizes crypto products like decentralized exchanges (DEXs), non-fungible tokens (NFTs), and DeFi.
Furthermore, you don’t need to use other tools since Dune Analytics also offers data extraction and visualization. And that’s not all! If you want, get help from community-based wizards to create stunning data analytics dashboards for a fee.
Dune Analytics enables everyone in the cryptosphere to make informed investment decisions by decentralizing the power of public blockchain data analytics. Read on for an in-depth understanding of this open-source on-chain analytics tool.
Table of Contents
Who Created Dune Analytics?
Dune Analytics’ GitHub portal showcases the following 5 individuals as the People connected to the project:
- André
- Bernat Fages
- Henrique Moniz
- Mats Julian Olsen
- Vegard Stikbakke
However, Mats Julian Olsen and Fredrik Haga founded Dune Analytics in 2018. The founding members have experience in building and analyzing blockchain smart contract data. Mats and Fredrik also have extensive experience in key technology fields like startup analytics, machine learning, and statistics.
Where Does Dune Analytics Get data?
Dune Analytics aims to change the business model of on-chain data analytics by offering an open-source platform. Now, you no longer need to depend on third-party developers or data analysts. Instead, you play around with the Dune Analytics tool and craft your own dashboards for NFTs, crypto coins, NFT coins, and DeFi projects.
Dune Analytics web app has access to decoded smart contract data and raw blockchain data. The team is also working to make more smart contract decoded data available.
The list of blockchains for on-chain data analytics on this tool is increasing. As of now, it has access to the following public blockchain data: Polygon, Optimism, Ethereum, Gnosis Chain of Ethereum (xDai), and Binance Smart Chain.
The developers at Dune Analytics partnered up with node providers in the blockchain industry. They work closely with the nodes to ingest data into the Dune Analytics database. The database includes almost all raw historical data from the aforementioned blockchain except state data.
Is Dune Analytics Real-Time?
Since the launch of Dune Analytics v2 on 18 Mar 2022, this cloud-based on-chain analytics app shows real-time data. The developers rebuilt the entire app from the ground up, like queuing system and query execution, so that the app can provide live data at scale.
Dashboard owners or query creators don’t need to create a refresh schedule for their projects. The Dune V2 app will automatically refresh any outdated data in the backend. The real-time data analytics feature is a huge advantage for Dune Analytics over its competitors. Since most closed-source and centralized blockchain data analytics platforms provide data inputs upon request from the user.
The Dune app utilizes intelligent programming to update data. For example, if you view a data visualization on a dashboard or query page, the app will also start analyzing the data in the back end. If it finds that you’re seeing >3 hours-old data, it’ll automatically refresh the on-screen data.
Is Dune Analytics Free?
Anyone can use dashboards inside Dune Analytics for free. You can also create a dashboard if you have some basic coding skills. Unlike other DeFi and NFT analytics tools, it’s built for and by the web 3.0 community, at no cost.
How Do You Make a Dune Analytics Dashboard?
Dune app content like counters, Pie charts, and graphs live on dashboards. You and your project users will also interact with the dashboard to get actionable data about your NFT or DeFi project.
Adding on-chain analytics content to the dashboard is super easy. All you need to do is choose a widget type like text box, visualizations, and so on and insert it into your project dashboard. To make your dashboard look more professional or cool, you can embed GIFs or images in text box widgets.
To create a dashboard, you need query data and their visualizations. If you don’t yet know how to perform an SQL query in the Dune app, that’s okay. You can still fork or copy a query from an existing query similar to your project.
Simply click on the Discover button in the top-left corner and type in the kind of query you’re looking for in the Search for queries box on the right-side navigation panel. Let’s say you want to create a query for NFT gas fees. Type that in the search box and choose a query from the search results.
The query will open with the SQL code on the top and a line chart below it. Click on Fork in the top right corner to import the SQL query to your Dune app account. Now, go to My Creations and select Queries. You should see the query that you added earlier.
Open the query and then click on the Run button. The Dune app will update the query table in a few moments. You can now scroll down below the line chart and click on Add to the dashboard to create a new dashboard using the query data.
Alternatively, you can click on Dashboards in the My Creations tab, and create a new dashboard from there. When you create a dashboard, choose the name wisely as you can’t edit it later. Click on Edit to add content as text widgets or visualizations. If you click Add visualization, you should see the query that you made earlier.
5 Popular NFT Dune Analytics Dashboards
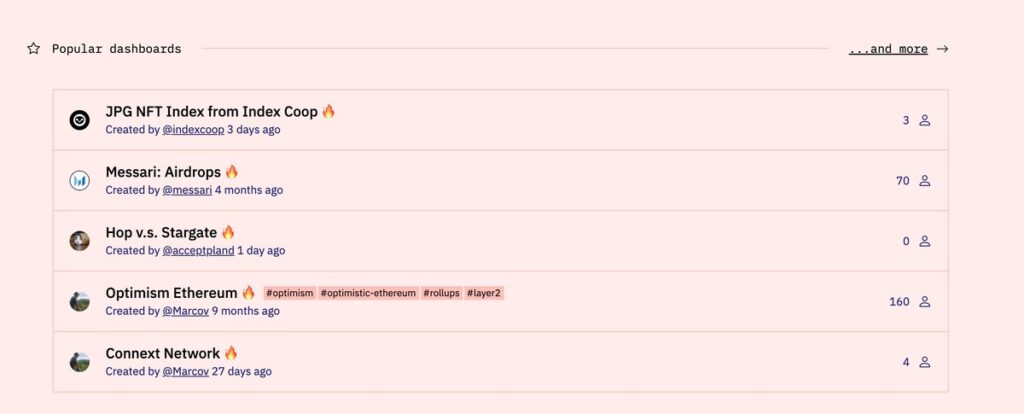
All of the dashboards and queries on the Dune app are public since it’s an open-source community-based data analytics platform. You’ll find some extraordinary dashboards and queries in the Discover tab of the app. All you need to do is perform a simple search using keywords like blockchain protocol, DeFi name, NFT, token, and so on.
The search result list will show a star score, dashboard/query age, publisher, and title. Choose the data analytics asset that has the maximum start rating and relevant title name. The followings are the 5 popular NFT dashboards on the Dune app:
1. NFT Project Dashboard
@rantum created this NFT dashboard to visualize details and analytics for almost all the NFTs. It has a star rating of 1,633. Moreover, there are several data visualizations like counters, line charts, bar charts, sales tables, and pie charts.
You’ll see detailed analytics of the Cool Cats NFT on opening the dashboard. But, you can change it to view data of another NFT project by changing the contract address.
2. Interactive NFT Floor Tracker
If you want an intuitive NFT floor price tracker, you can try out the one created by @smaroo. It lets you change various input parameters like NFT contract address, start date, and floor time interval. The Dune app shows that the dashboard has a star score of 1,259.
3. CUSTOM NFT Dashboard
With 528 star ratings, @cryptuschrist’s CUSTOM NFT dashboard is also one of the finest data analytics tools of the Dune app. You can simply change the NFT contract address to fetch various data on any NFT project.
For example, you can get daily floor price, collection sales, ETH transaction volume, sales price feed, area chart of holders, top owners, and so on.
4. LooksRare VS OpenSea
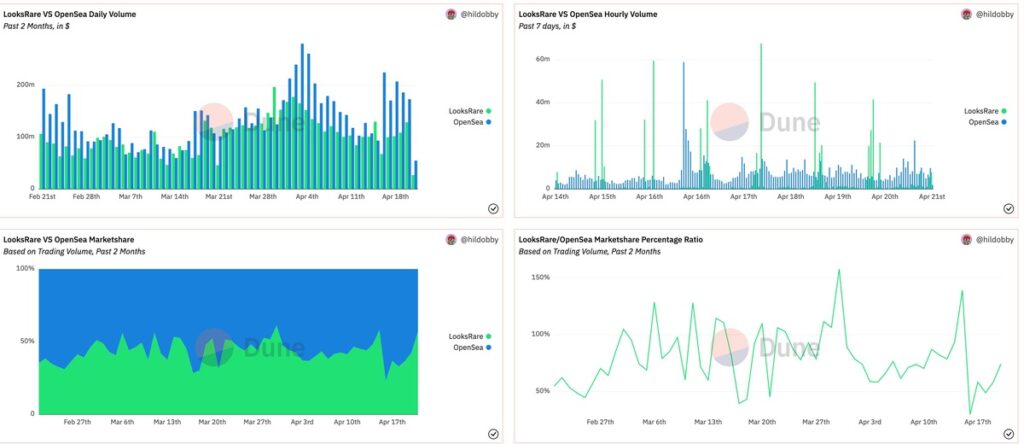
If you’re an NFT marketplace enthusiast and want to compare two marketplaces, you should look at this dashboard. The dashboard owner is @hildobby, and it has a star rating of 929.
The dashboard visualizes SQL query data using components like counters, bar charts, area charts, and line charts. A few crucial data you can see are total volume, total users, and total transactions of both LooksRare and OpenSea.
5. NFTs Secondary Market (Ethereum)
An expert NFT investor will look at the secondary market movements before selling your NFTs or buying new ones. Look for statistics about trade volume, hodlers, and price trends.
You can do that easily by using the NFTs Secondary Market (Ethereum) dashboard from @hildobby.
The data analytics shows an elaborate table of top-ranking NFTs, trending NFT projects, buyers vs. sellers data, transaction count, and a detailed comparison for secondary NFT marketplaces. The dashboard has already earned 614 stars from its users.