Discover what is NFT volume trade in our guide to this important metric for new NFT traders and collectors.
Non-fungible token (NFT) project leads, collectors, traders, and investors use several metrics to evaluate the value of NFT collections. For example, whether it’s a blue-chip asset, going to deliver a good return on investment (ROI) in the future, need to hold on to it for better profit, and so on. One such key metric is NFT volume traded.
Volume traded or trading volume of an NFT collection refers to the total amount of currency like ETH or USD exchanged between the buyer and seller in a specific time interval. Most investors, collectors, and projects follow volume traded metrics to evaluate digital assets.
Read on to find out all you need to know about NFT trading volume so that you can also evaluate some NFT collections on your own. As a bonus, I’ll also introduce you to some cool decentralized finance (DeFi) apps that enable you to track NFT trading volume. Let’s dig in!
Table of Contents
What Is Volume in NFT?
NFT trading volume is the total number of successfully completed trades in one NFT collection or across the Ethereum network for a specific time period.
For example, If a specific Doodles NFT changes hands 1,000 times in an hour, then the hourly traded volume for that NFT is 1,000. In a nutshell, the trading volume includes all the successful sales of an NFT.
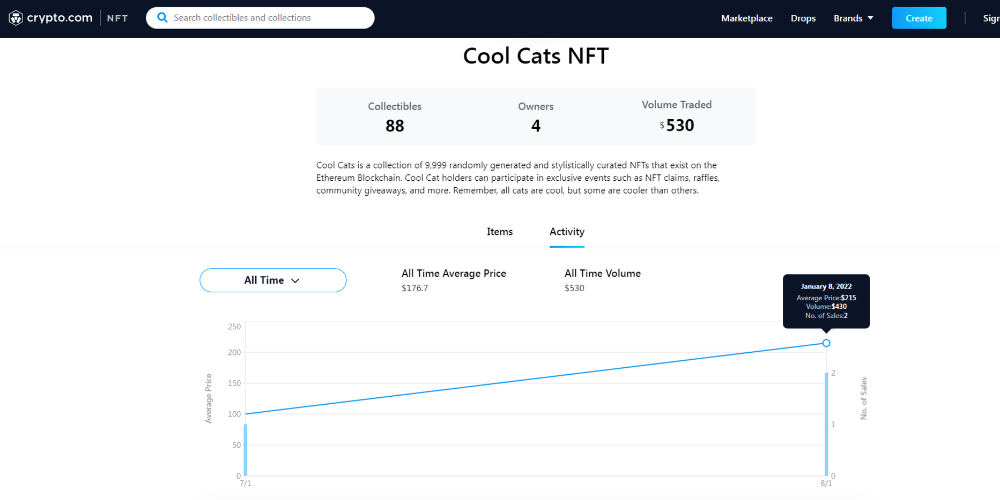
Alt-text: What Is Volume in NFT visualization from Crypto.com for Cool Cats NFTs
Almost all the NFT marketplaces will show you a volume traded metric for an NFT asset. You can also look for the trading volume for a complete collection of 10,000 NFTs.
NFT Volume Traded Influences the Market
Most NFT experts consider if the volume traded of an NFT collection is moving up than the previous day, then the collectors and traders are liking the digital asset.
On the contrary, if the trading volume is going down, collectors are selling their stakes on that asset. It also indicates how liquid the asset is.
However, there are reports of fake and fraudulent pumped-up trading volumes of certain NFTs. Scamsters buy and sell NFTs to themselves by using multiple self-financed wallets to inflate the volume traded metric. One such big scam was for CryptoPunk 9998.
How to Calculate NFT Trading Volume
The NFT platforms use automated tools to sum all the sales for 1 day, 7 days, 30 days, etc., for every listed NFTs. Thus, the platforms fetch the volume traded data in said intervals.
Some DeFi apps may also let you change the To and From date, and convert the transaction volume into ETH or USD values for easier interpretation.
Let’s consider you buy the #2815 ape from the Bored Ape Yacht Club (BAYC) collection for 60 ETH and sell that for 100 ETH. The buyer again sells it for 110 ETH by the day’s end. So, the 1-day trading volume for this NFT will be 270 ETH.
4 Best Tools to Analyze NFT Trading Volume
1. NFT Stats
NFT Stats is the most easy-to-use data analytics platform for NFT evaluation. The platform automatically shows a top collection of NFTs according to their rankings in the last 24 hours.
When you access a specific NFT collection, it shows figures like NFTs sold, trading volume, average price, etc.
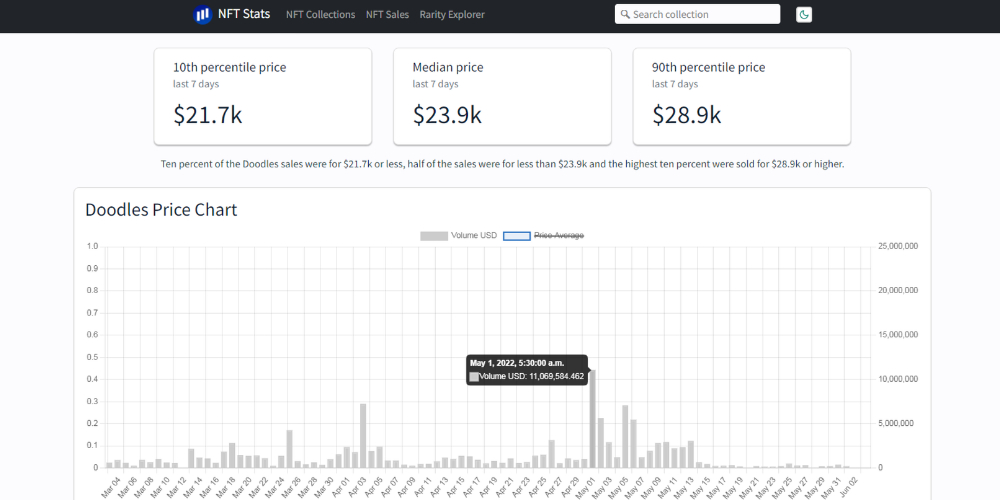
You can scroll down to the NFT price chart to find a graph showing Price Average and Volume USD plotted on a line and bar graph. If you hover the cursor over a trading volume bar, you’ll discover the date, time stamp, and USD volume traded.
2. OpenSea
OpenSea is by far the largest and oldest NFT marketplace the world has seen. It’s also the most sought-after marketplace for most NFT projects for minting and secondary market listing.
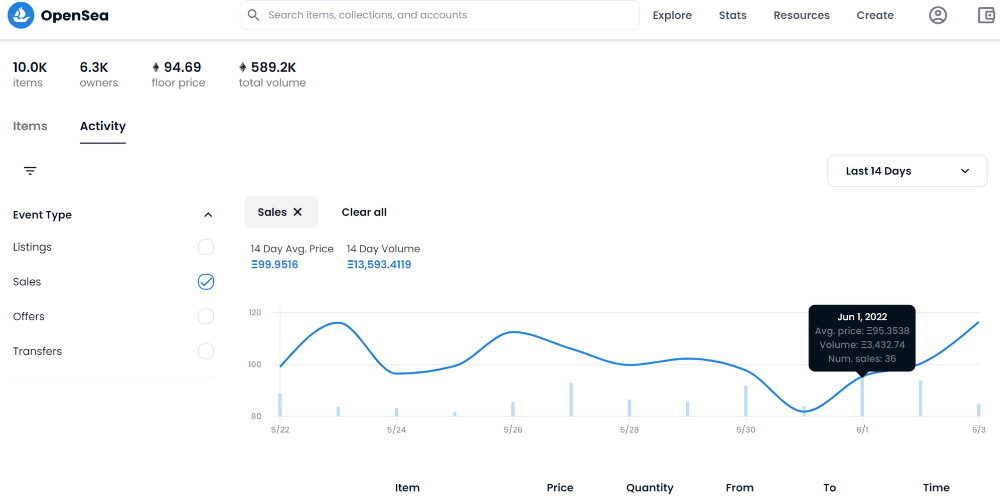
OpenSea lets you find out the volume traded figure of an NFT collection from the Activity tab. By default, the platform shows trading volume for the last 90 days. But, you can change that to last 7 days, last 1 year, all, etc.
3. CoinGecko
CoinGecko also offers extensive analytics reports for digital assets or platforms like cryptocurrencies, exchanges, NFT coins, DeFi apps, etc. You can navigate to the NFT Floor Price collection to reveal volume traded data on NFT collections.
It simply displays the 24h Volume in ETH equivalent and an overall market cap of the NFT collection in ETH.
4. DappRadar
DappRadar is yet another popular and reliable source for data on every DeFi project, NFT collections, blockchain games, and so on. Its NFT trading volume chart is beautiful-looking, clutter-free, and downloadable in SVG, PNG, and CSV formats.
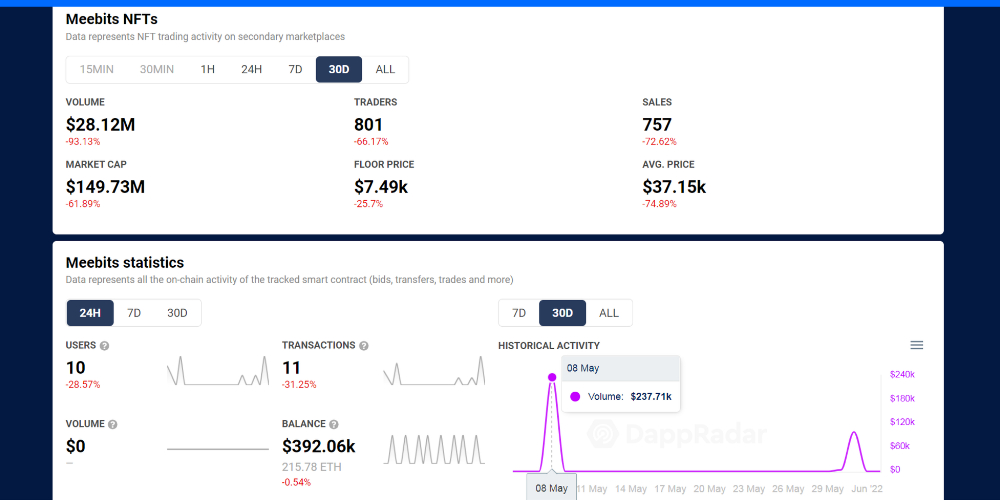
Let’s say you open the Meebits NFTs and scroll down to the Meebits statistics section. There you’ll find the Historical Activity chart that plots three graphs using the volume traded, users, and transactions data. You can turn off users and transactions to get a clear view of the trading volume (in USD) line chart in periods like 7 days, 30, days, and All.
Apart from the above tools, some other notable NFT analysis tools that you can try to track NFT volume traded are Nansen, Dune Analytics, and Crypto.com.
NFT Volume Trade: The Final Word
So far, you’ve learned about NFT trading volume in detail, how this metric influences NFT’s market movements, and some tools to track volume traded data. Though you’ll find most collectors and traders rely on this metric, you shouldn’t go that route.
Instead, access the documentation of an NFT project and look for value-adding propositions, community standards, etc. If you blindly rely on the trading volume of NFTs you might become a victim of the NFT wash trading scam.